Feature
Charts
Visualize data with various chart types and customize colors, labels, legends, and interactions.
Visualize data with various chart types and customize colors, labels, legends, and interactions.
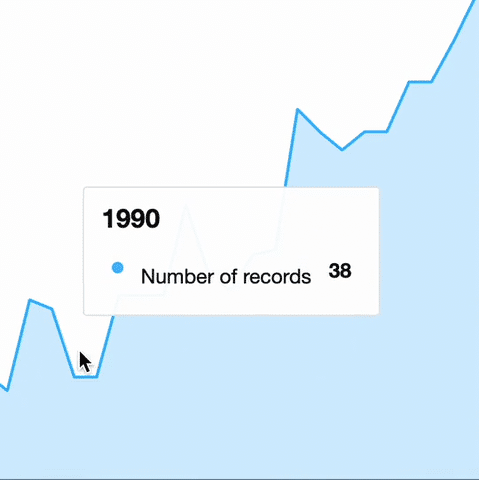
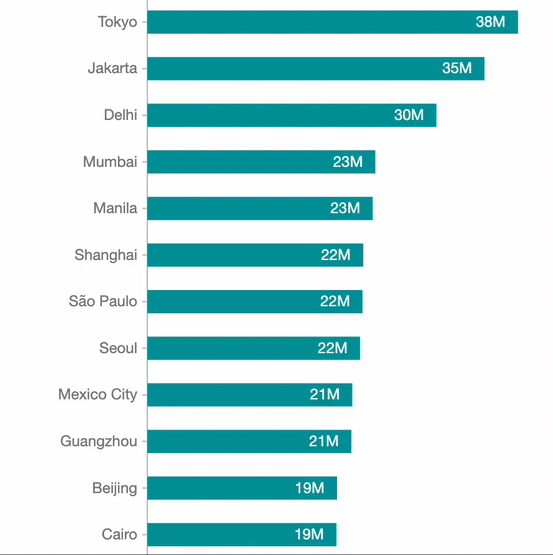
The Chart component provides a diverse range of chart types like line, bar, column, scatter plots, etc., suitable for different data visualization needs.
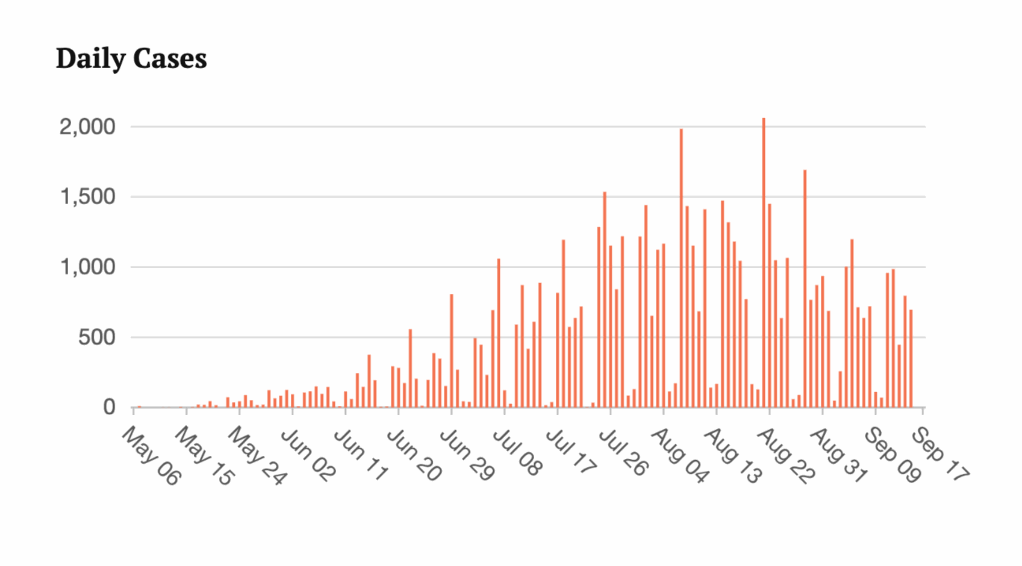
Customize chart colors, labels, legends, axes, and more, align with your design and brand, and enhance data exploration with tooltips and data labels.
The Chart component supports interactive features such as hover effects and click events, making charts more engaging and informative.